

This shows how an Analog Way LivePremier allocates its VPU mixers across screens, layers and slices.
Every layer on a LivePremier costs physical mixing hardware. The device knows exactly where that hardware went and will tell you — but the stock Web RCS shows it a panel at a time. This puts the whole chassis on one screen.
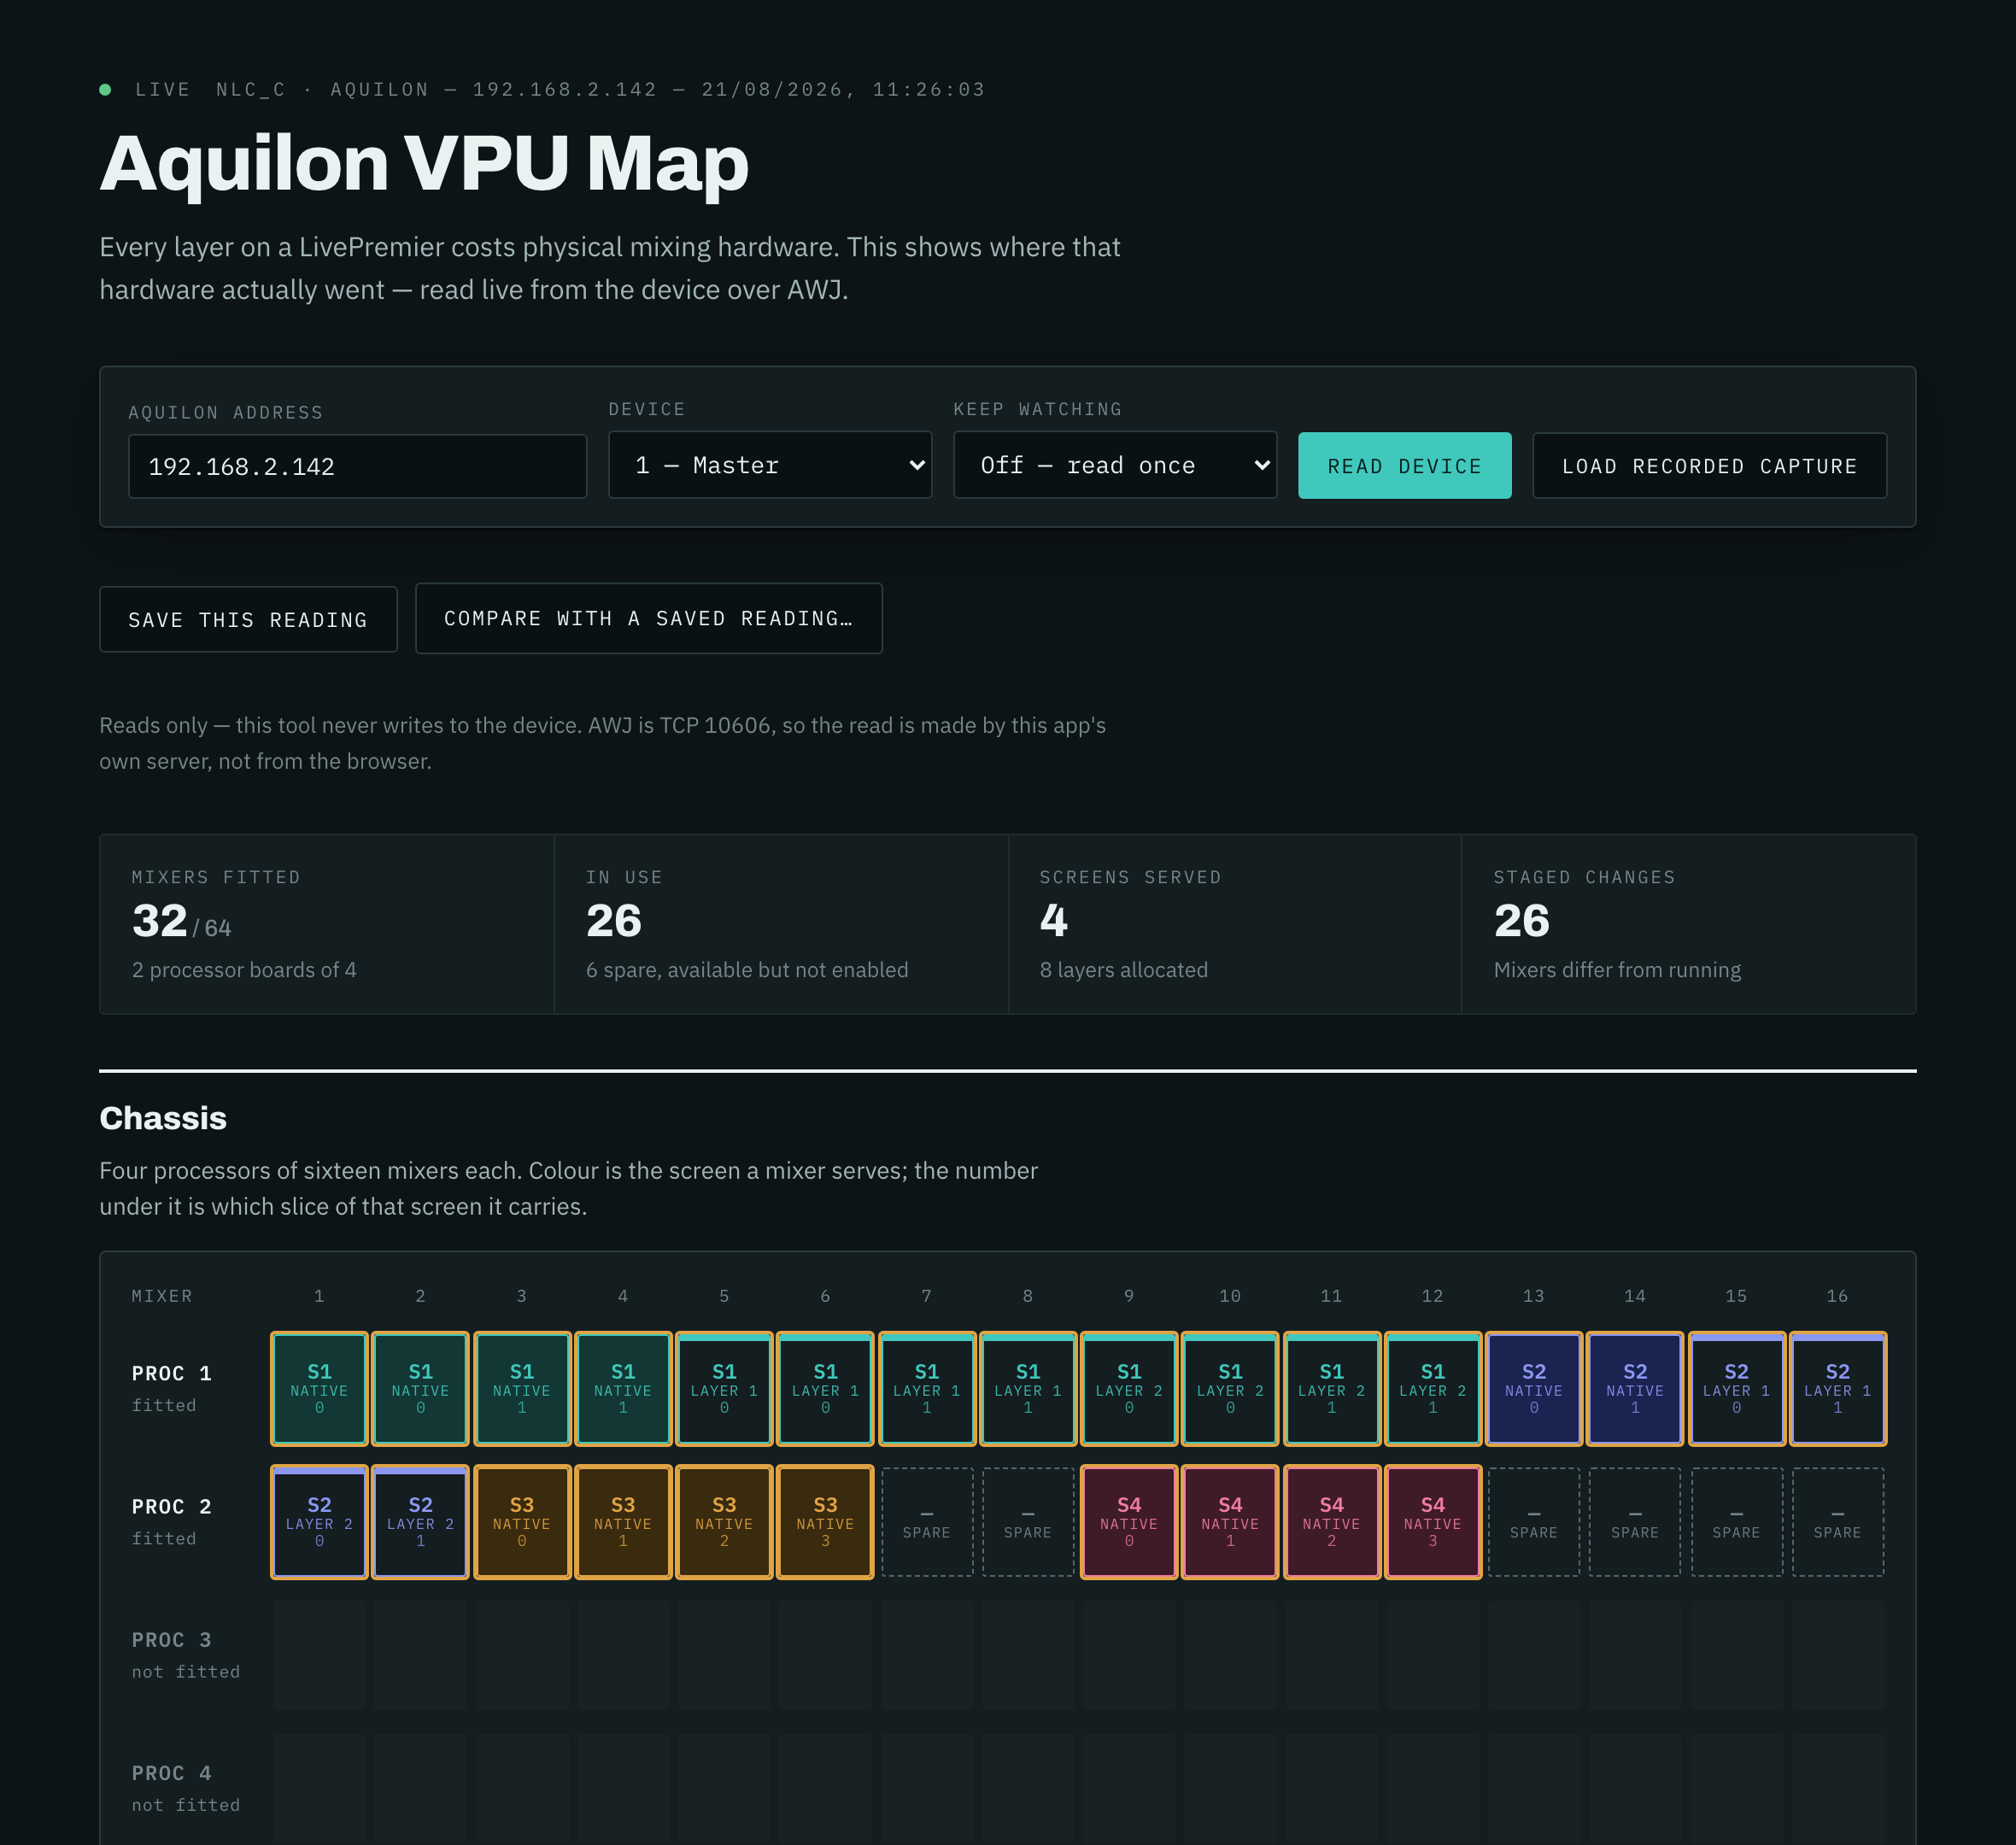
Before you rely on this: it has read a real Aquilon C end to end, in two different configurations — the captures, the tests and the screenshots all come from that device, and the second configuration corrected two things the first had made look settled.
Still untested: Link setups (devices 2–4), capacities other than 4K and 5K, combined VPUs, Optimized mode and Cut & Fill. The model was re-checked against a second Aquilon C on 2026-09-09 and held, but there is no frame here between visits, so those are configurations somebody with hardware has to build.
This codebase was created with AI assistance, directed and reviewed by a human author.
It reads only. Nothing in this tool writes to the device.
What a VPU mixer is
A VPU mixer is the physical mixing and scaling resource the device allocates to a (screen, layer) pair. An Aquilon has up to four processors of sixteen mixers — 64 in total, though most chassis are part-populated.
A layer too wide for a single mixer is split across several, each carrying one slice. That is why an eight-slice native layer can consume an entire processor board on its own, and why counting layers never tells you whether a configuration will fit.
The device reports this map read-only and keeps two copies: current (running) and new (staged).
This tool shows the running map and highlights anything the staged one would change — which is
the view you want before pressing anything on the desk.
Using it
The desktop app is the easiest way in — double-click, nothing installed. macOS, Windows or Linux, about 2 MB, because it uses the system WebView rather than bundling a browser.
The macOS build is not signed yet, so Gatekeeper refuses it on first open with a message that reads like the file is damaged. Right-click → Open, once.
Or run the server with npm start and open http://localhost:8531.
Same UI either way; the difference is only how it reaches the switcher — on the desktop, the connection is made directly rather than through a server.
Screens are named the way you named them — “S1 · Main LED”, read from the device. Those names are live-only; the recorded captures are redacted.
Reading the link grid
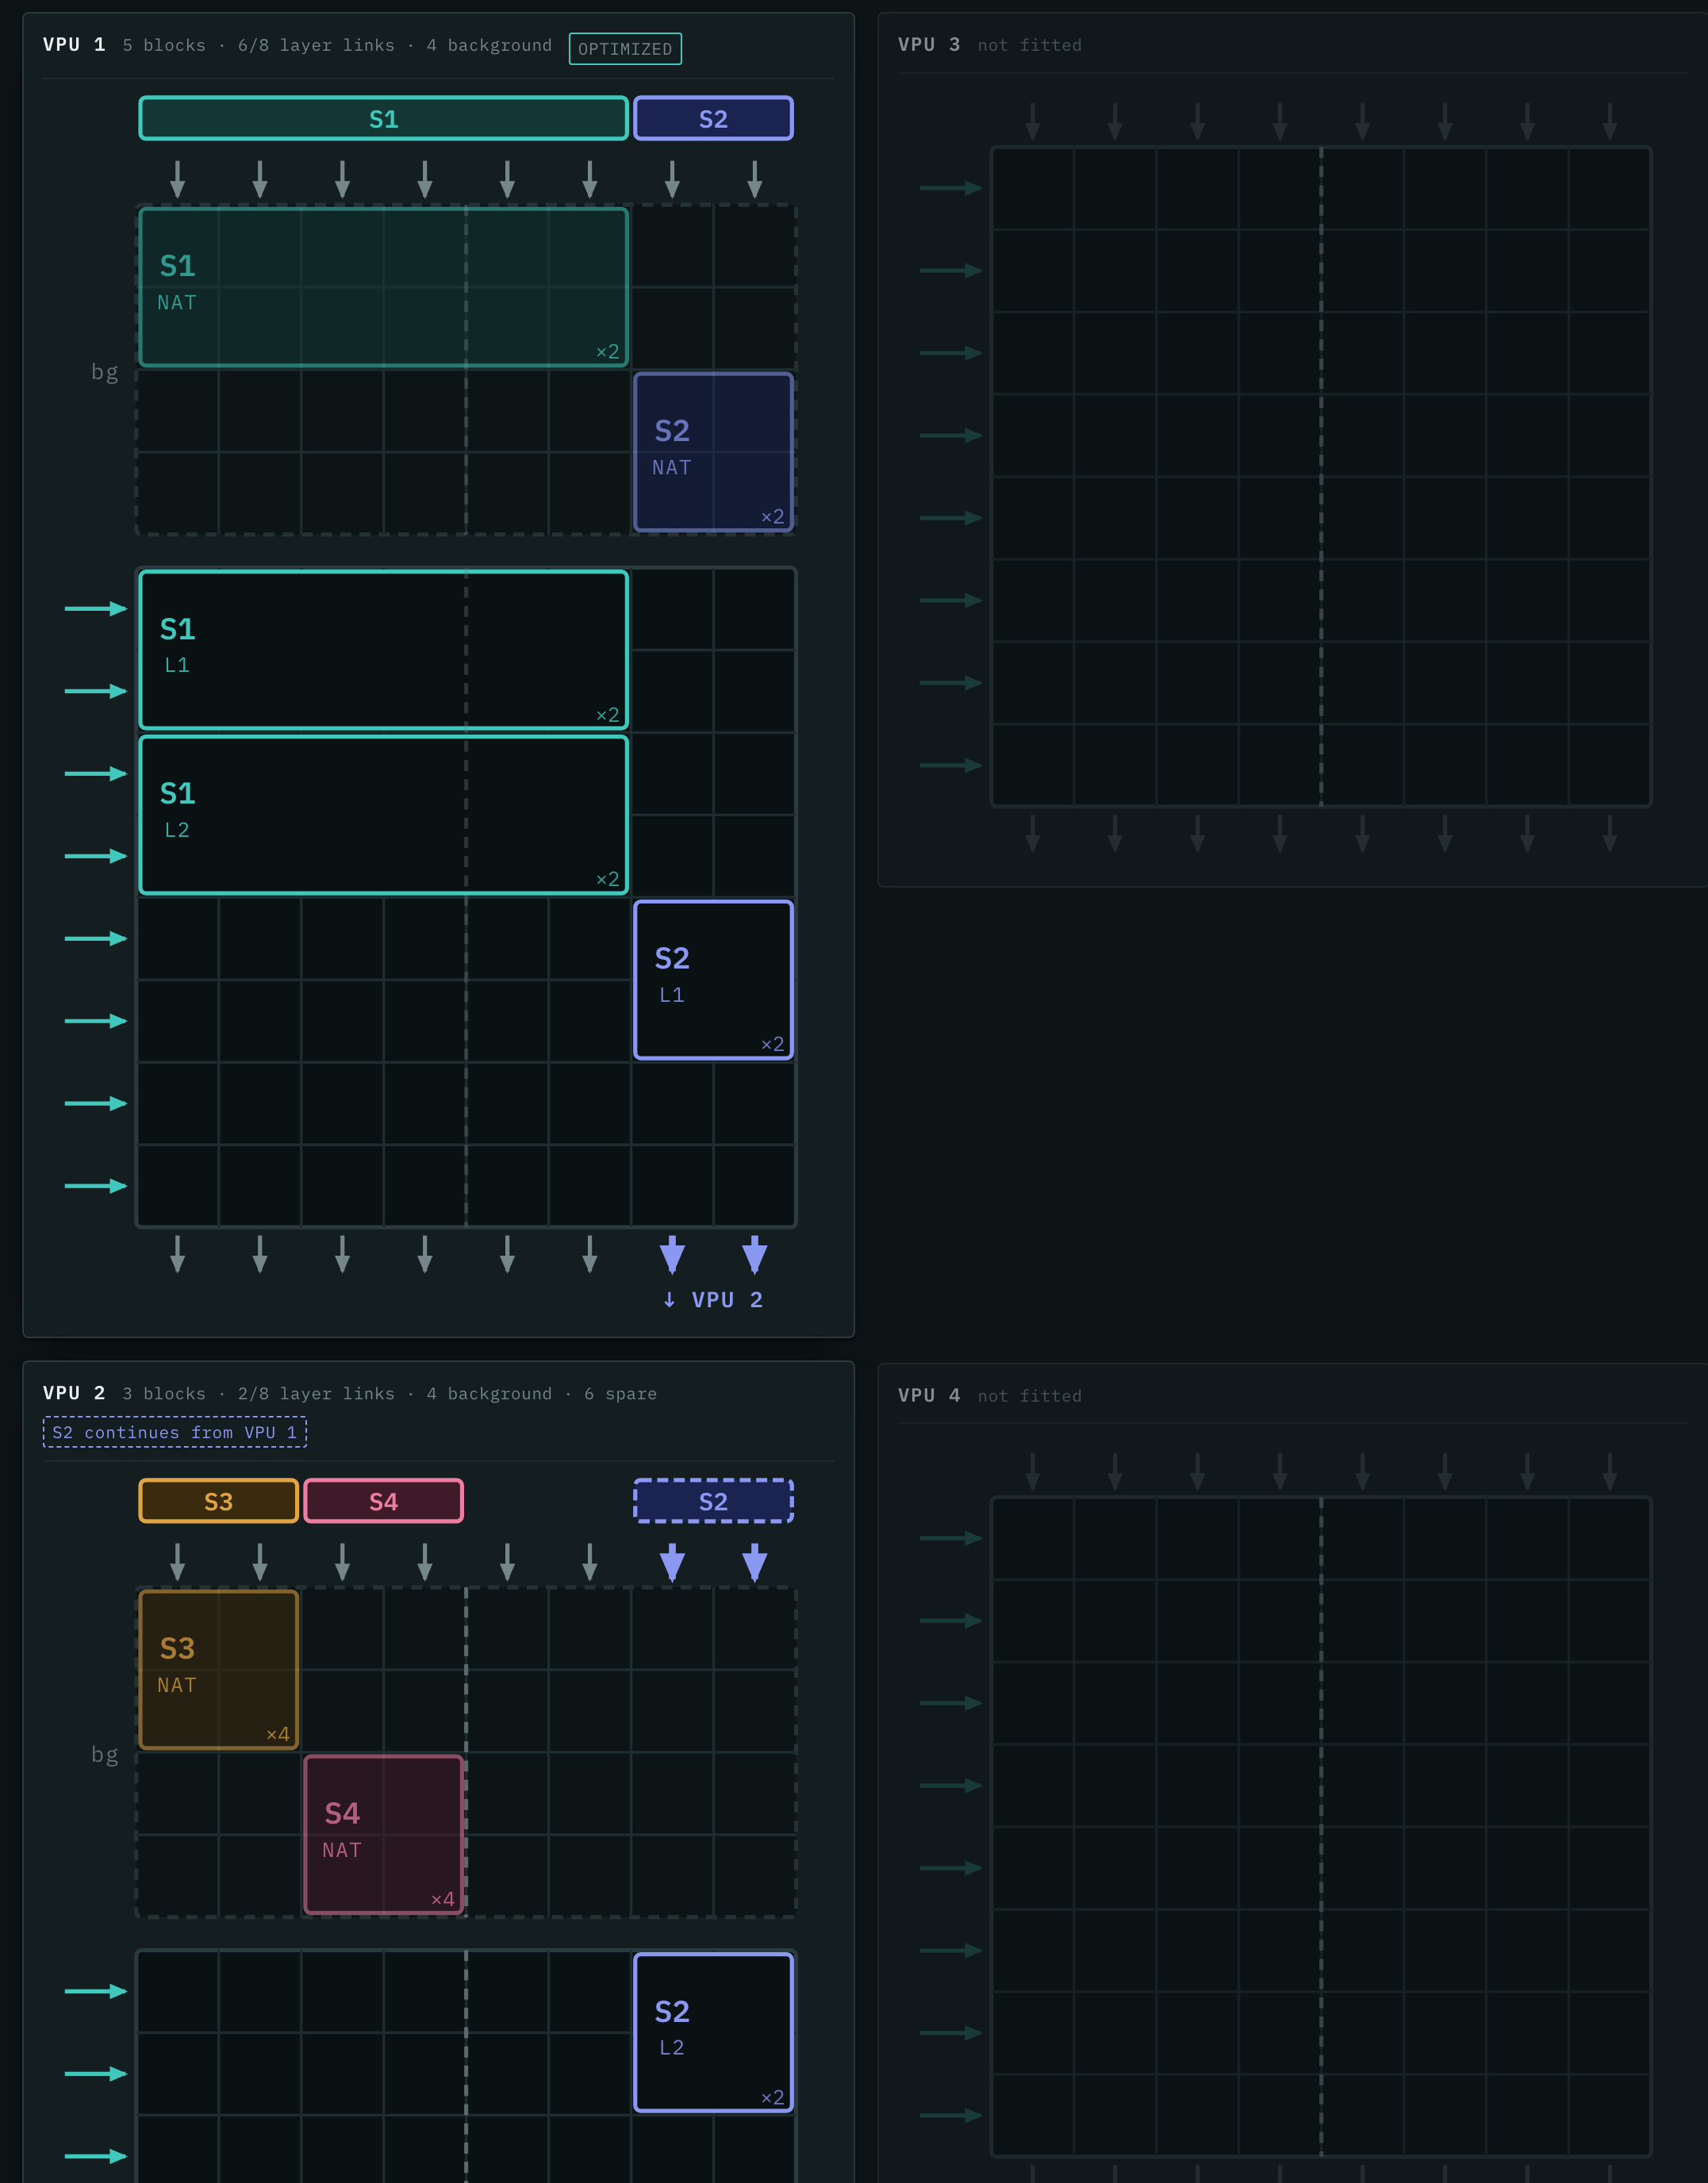
The manual draws a VPU as an 8×8 field of links — eight layer links in from the left, eight output links in through the top and out through the bottom. It is a crosspoint field, and this view follows the manual’s own figures, read top to bottom the way an output link runs through it:
- A row is one layer-capacity link, and it carries one layer. Two layers never share a row. A layer is as tall as its capacity: dual link (up to 4K30) is 1, 4K60 is 2, 5K60 is 4.
- Columns belong to screens. Each screen owns a contiguous run of output links, as wide as the number of outputs it uses, and screens sit side by side — two four-output screens fill a VPU as links 1–4 and 5–8. All of a screen’s layers therefore start at the same link.
- A layer’s bar is continuous, and breaks at the centre line. A layer spread over more than four output links takes another layer link and wraps onto it, drawn with the manual’s hook. A twelve-output screen’s layer costs three links, over two VPUs.
- Optimized mode lifts that boundary for capacity-2 layers, and only those, so on an optimized VPU their bars run unbroken across the centre line.
- A screen’s native background is not layer capacity. It is reported like a layer and holds mixers, but it is drawn dimmed in a band of its own, above the field, and left out of the layer-link count: the native is the bottom of the stack, so it is the first thing on the output link, with layer 1 over it and the rest down the field.
- A screen that runs out of mixers continues on the next VPU. Its next layer is allocated
there on the same output links, so the link runs out of the bottom of one VPU and into the
top of the next. Those two cards are stacked, the screen keeps the same columns on both, and
the arrows at both ends take the screen’s colour, with
↓ VPU 2under the leaving ones and “continues from VPU 1” on the arriving card. - The header names each link. The screen bar is always there. On a live read, two rows under
it say which region and which output plug each link is —
R1,Out 5— with the output’s label, connector type and card in the tooltip. A 4K output is two links wide. Of the recorded captures only the fourth carries the outputs; on the other three the header stops at the screen.
Why the columns are not what the device’s keys say
The device reports each mixer as a pair, and the two halves disagree.
The key is the VPU pipe the mixer is wired to, and those are interleaved — a six-output screen’s first mixer sits on pipes 1, 3, 5 and 7. The value is which of the screen’s output links that pipe carries, and those are 1, 2, 3, 4: in order, contiguous, and what the manual draws.
Reading the keys as columns puts a screen’s layers on scattered links and lets a bar reach across the centre line, which the hardware cannot do. So the view uses the values.
Nothing in the protocol names the layer link — the row — at all. It does not need to: the rules above fix how many links each layer spends and forbid sharing, so only the order down the field is this tool’s choice, and it follows the device’s own mixer allocation order.
Nothing names the output behind a link either. The header takes that from the outputs themselves — each says which screen and region it is in, and its capacity — dealt out over the screen’s links in output-number order. The paths and the sums hold on a real box; the order is the only one the object model offers and no box has yet confirmed it, because every screen read so far had a single output. So the tool checks the outputs against the screen’s own output count and capability figures and draws no header for a screen that does not add up.
Working without a device
Four recorded configurations ship with it, and they are the whole ground truth. Every one is offered in the app’s Recorded capture picker, and the tests run off them.
node scripts/capture-config.mjs --reportaudits them with no device needed: what each capture proves, and which questions none of them can answer — a capacity-1 layer, an over-budget configuration, Cut & Fill actually enabled, a screen too wide for one VPU, the order of a screen’s links over several outputs.
If you have hardware and want to settle one of those, CAPTURE-GUIDE.md assumes nothing: what to set up, what to run, and what it settles. Recording one is:
node scripts/capture-config.mjs <ip> --name capacity-1 --label "Dual-link layer"which writes a redacted capture and lists it in the picker.
If something looks wrong
A layer’s bar crosses the centre line and I am not in Optimized mode. That should be impossible. Either the capacity is 2 and the VPU is optimized, or it is a bug worth reporting with a capture.
A screen’s layers are on scattered links. Also a bug — see the columns note above; that is exactly the symptom of reading the pipe keys instead of the link values.
The map does not match what I just changed on the desk. The tool shows the running map. A staged change is highlighted rather than applied — that is the distinction the two copies exist for.
Nothing is reported for a Link setup. Devices 2–4 have never been tested. That is on the list above, not a fault to chase.